>>
Technology>>
Data analytics>>
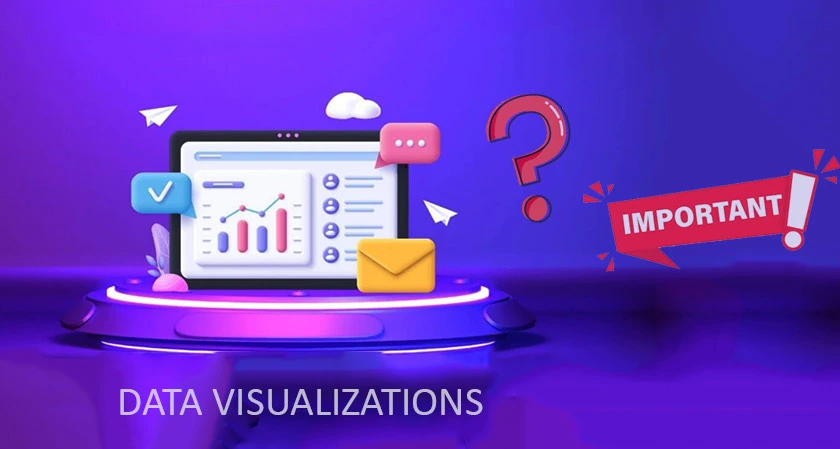
Why Data Visualizations Are So...Why Data Visualizations Are So Important
The Silicon Review
09 June, 2023
Data doesn't tell a story — or does it? Think about all the information you might gather about a person who comes into a store to purchase something. You might have their name, the product they bought, how much they paid for it, and the day or month they purchased it.
Now, think about if you took this data and created a data visualization from it. You might be able to see patterns or even see a story being told.
Data visualizations can be helpful for almost any business. Read our guide below to learn more about what they are and why your business should use them.
Simplifies Complex Information
Data visualizations are an excellent way to simplify complex information. They allow us to quickly comprehend and interpret large datasets. Through the use of charts, graphs, diagrams, and maps, data is concisely communicated.
It is also becoming increasingly important as the need for data-driven decision-making grows. As data becomes increasingly complex, visualizations can help us make sense of it quickly and accurately.
Enhances Decision-Making
Visualizations allow data to be distilled into an easy-to-digest image, saving time and energy. This way, decisions can be made more quickly and with confidence. It can also help to identify patterns and outliers in the data, which can lead to better decisions being made.
When information is presented graphically, it's easier to understand and identify key points. It can also help reduce cognitive load, enabling faster decisions to be made. All of these features help to make data visualizations an invaluable tool for decision-makers.
Increases Data Engagement
Data visualizations can help turn vast amounts of data into digestible insights, which can then be used to inform decisions. For example, through the use of charts, graphs, and dynamic maps, data can be quickly converted into information that is easier to understand.
This allows viewers to identify patterns and relationships within datasets. They also present information in a visually appealing way, making it more inviting and easier to comprehend. It can even help viewers detect anomalies in data that may have otherwise gone unnoticed.
Enables Data Discovery
Data discovery is not just about finding out what the data is but discovering new insights and trends that can help in decision-making and predicting future outcomes. Data visualizations are also essential for exploring data from multiple sources to gain a more comprehensive view.
Learning how to make an infographic is a great way for business leaders to easily and quickly interpret a large volume of data to better understand their businesses and stay competitive.
Drives Action and Impact
Research has shown that humans are much more likely to remember visual information than complex data sets. By displaying data in a way that is easy to understand, it can be used to:
- Create awareness
- Interest
- Call to action
Additionally, visuals help to convey complex information that could be difficult to explain using words alone. By utilizing visuals, complex data can be made more accessible, which can help to drive action and influence decisions.
Unlock the Importance of Data Visualizations Now
Data visualizations make complex data easier to understand and encourage people to take action. They help organizations make better decisions, see patterns, and find insights.
They allow people to make connections they may not otherwise have seen from data alone. It is a powerful tool to gain knowledge and incite action. Now, go explore the world of data visualizations and find the story your data is telling.
Looking for other informative articles? Check out the rest of our website today!
MOST VIEWED ARTICLES
RECOMMENDED NEWS


TOP NEWS
YOU MAY ALSO LIKE


_2025-11-17_06-38-14.webp)


_2025-12-15_12-44-58.webp)