>>
Technology>>
Data analytics>>
From Border Watch to Boardroom...From Border Watch to Boardroom: The Rise of Satellite Analytics
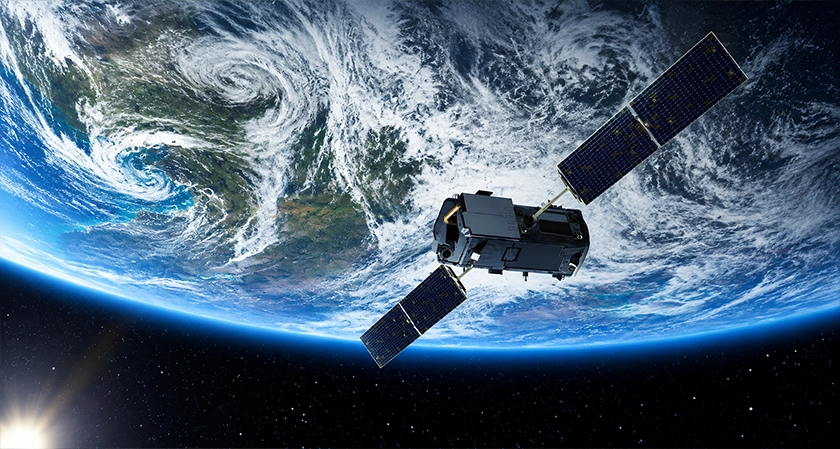
There's a gap between what satellites can technically do and what most people assume they're used for. Ask someone what satellite imagery is good for, and they'll say spying, or maybe weather maps. Neither answer is wrong, but both are years out of date.
The satellites themselves haven't changed much, but the pipeline behind them has gotten much faster. Ordering satellite imagery tasking, once a days-long process reserved for governments with deep budgets, now takes minutes and costs a fraction of what it used to. This is why industries with no history in satellite analytics now have a reason and opportunity to apply it.
How Satellite Intelligence Pipelines Evolved
Nothing about satellite imagery moves slowly anymore, and the market reflects it: valued at $4.8 billion in 2024, it's expected to nearly triple to $10.6 billion by 2032. Behind that number is a pipeline that's been rebuilt for speed at every stage.
Take satellite tasking. Getting a satellite pointed at specific coordinates within a set window used to require days of coordination with an operator. This step now runs through automated feasibility checks and gets confirmed in a few minutes to a few hours.
Once the imagery arrives, it's still raw. Calibration, atmospheric correction, cloud masking — these strip out the noise and distortion baked into any satellite image. Ground stations handled this in hours. Cloud pipelines handle it in about thirty minutes.
Analysis used to be the slowest part by far. A patient human analyst spent half a day looking for meaningful changes in a stack of images. AI models now do that work in minutes, flagging what changed and how sure they are about it.
Where Satellite Analytics Gets Used
Ask who actually uses tasking and satellite analytics today, and the honest answer is: almost everyone who needs to know what's happening somewhere they can't physically go. Defense agencies still lead in volume, but insurers, farmers' cooperatives, and city halls aren't far behind:
-
Defense and security — tracking troop movements, naval assets, and border activity; combining radar and optical passes reveals hidden installations even through cloud cover.
-
Disaster response — mapping earthquake, flood, and wildfire damage within hours instead of days, directly shaping how fast responders reach affected areas.
-
Environmental monitoring — detecting deforestation, glacier retreat, and illegal mining by comparing imagery across years.
-
Urban planning — analyzing sprawl, heat islands, and nighttime lighting to guide transit and zoning decisions.
-
Climate research — measuring sea-level rise, drought severity, and vegetation stress through continuous satellite observation.
-
Business intelligence — counting ships in ports, estimating crop yields, and tracking industrial assets for insurers and energy firms.
In every case, satellite imagery tasking supplies raw data, and AI turns it into a number or conclusion someone can act on immediately.
A Real-World Test of Satellite-Powered Analytics
A group of undergraduate researchers in the Hydraulics Department of the Engineering School in Argentina faced a practical problem: a river basin near Salta kept flooding, wrecking railway tracks and roads every few years. They had a hunch — deforestation and farming were changing how the land absorbed rain. But the hunch isn’t enough. They needed a number, and through an academic grant, EOSDA gave them access to the satellite analytics to calculate it:
-
Fifty+ years of imagery, from 1968 archive photos through 2019 data, gave them a timeline to work with.
-
NDVI and EVI readings tracked how much forest had thinned out over that period.
-
Land classification separated healthy vegetation from bare, waterlogged soil losing its ability to soak up rain.
-
All of this fed into the curve number, a hydrology metric that rises as land loses runoff absorption capacity.
The curve number had been climbing steadily for five decades. This proved that floods weren't bad luck, but measurable and now actionable for local communities.
Next-Gen Satellite Intelligence
Nobody expected agricultural co-ops and ESG analysts to become everyday satellite customers. But that's what is happening somewhere on the way from $4.8 billion to a projected $10.6 billion, and it's worth understanding why.
Start with how often satellites pass overhead now. Constellations like Planet and Spire put hundreds of satellites into orbit, so a field or coastline can be captured several times a day instead of once a week.
This mountain of daily imagery would be useless if humans had to inspect every pixel. Instead, computer vision models do the heavy lifting, such as counting vehicles or spotting oil spills. When an algorithm flags an anomaly, it can even automatically task a satellite to capture high-resolution close-ups on the very next pass.
At the same time, the corporate world ran out of patience with self-reported PDFs. If a palm oil supplier claims zero deforestation, ESG teams skip the questionnaires and run targeted satellite imaging tasking straight over the concessions. Thermal imagery catches actual factory stack heat, optical feeds measure solar farm construction, and climate funds track carbon offsets tree by tree. Space data simply became the cheapest, fastest detector of corporate bluffing.




















Comments