>>
Other>>
Others>>
External Data Integration &nda...External Data Integration – A Newspaper Approach

The Silicon Review
28 November, 2023
Author:
The Silicon Review Team
Abhijeet Singh Bais
Research Scholar at Department of CS & IT, IIS (Deemed to be University), Jaipur
Abstract:
This research paper explores the use of the Newspaper Reading Method as an approach for integrating external data into organizational systems. External data, such as social media, news data, natural disasters, legal issues, and compliance portals, holds valuable insights that can enhance decision-making processes. However, extracting relevant information from these vast datasets poses a significant challenge. To address this, a context-based approach utilizing a Vector-based Knowledge Graph is proposed. The effectiveness of this approach is validated through a case study involving a US-based SAP consultancy firm for backorder prediction. Additionally, the paper discusses the application of NLP neural vectors for inference and correlations and the use of graph databases, specifically Neo4j, for data correlation and knowledge graph implementation. The conclusion highlights the importance of detecting correlations and understanding the relevance of external data to the ecosystem or organization.
Introduction
1. 1 Background
In today's data-driven world, organizations are constantly seeking ways to leverage external data sources to gain valuable insights and improve decision-making processes. External data, which encompasses various types such as social media, news data, natural disasters, legal issues, and compliance portals, can provide a wealth of information that is relevant to organizational ecosystems. However, the sheer volume and complexity of these datasets pose a significant challenge when it comes to extracting and analyzing the most relevant information.
1.2 Significance of External Data Integration
This research paper introduces the Newspaper Reading Method as an innovative approach for integrating external data into organizational systems. Inspired by the way humans read newspapers, where they skim through headlines and selectively read articles based on relevance, the Newspaper Reading Method applies a similar concept to data analysis. It aims to filter and correlate external data based on its relevance to the ecosystem or organization.
1.3 Research Objectives
The primary objective of this research paper is to propose a context-based approach for external data integration, leveraging a Vector-based Knowledge Graph. The Knowledge Graph acts as a framework for representing and organizing relevant concepts and relationships within the data. By constructing a context upfront, the framework enables effective correlation analysis when external data events occur, facilitating the assessment of their relevance to the ecosystem.
Understanding External Data
2.1 Definition of External Data
External data refers to information and datasets that are sourced from external or third-party sources outside the organization. This data is generated by various entities, such as social media platforms, news outlets, government agencies, compliance portals, and other external sources. It encompasses a wide range of data types, including textual, numerical, multimedia, and geospatial data.
2.2 Examples of External Data Sources
Examples of external data sources include social media platforms like Twitter and Facebook, where user-generated content and discussions can provide valuable insights into customer preferences, opinions, and market trends. News data from reputable news outlets offers real-time information on current events, industry developments, and economic indicators that can influence business strategies. External data can also include information related to natural disasters, such as earthquakes or weather data, which is essential for risk assessment and contingency planning. Legal issues and compliance portals provide regulatory and legal information that organizations need to stay compliant with laws and regulations.
2.3 Importance of External Data for Organizations
External data holds immense value as it provides insights and information that can significantly impact decision-making processes within organizations. It offers a broader perspective by incorporating external factors, trends, events, and sentiments that are relevant to the organization's ecosystem. By integrating external data into organizational systems, businesses can gain a more comprehensive understanding of their environment, identify emerging opportunities and risks, and make informed strategic decisions.
However, the extraction of relevant information from these vast external datasets presents a significant challenge. The volume, variety, and velocity of data make it difficult to filter out noise and identify the most pertinent insights. It requires advanced techniques and methodologies to analyze, process, and correlate the data effectively. The proposed approach in this research paper, the Newspaper Reading Method, aims to address this challenge by applying a context-based approach utilizing a Vector-based Knowledge Graph.
The Newspaper Correlation Approach
3.1 Newspaper Reading Method as an Analogy
An innovative approach to integrating external data into organizational systems. Similar to how individuals read a newspaper, where they initially skim through the headlines to identify relevant topics before delving into the details, this method aims to filter and correlate external data based on its relevance to the organization's ecosystem or interests.
When reading a newspaper, readers naturally gravitate towards articles and news items that align with their specific areas of concern or curiosity. They focus on topics that are likely to impact their lives or the domains they are interested in. In a similar vein, the Newspaper Reading Method applies this filtering and relevance-based approach to external data analysis.
3.2 Extracting Relevant Data through Correlation
The vast array of external data sources, ranging from social media platforms to news outlets, presents a challenge in extracting the most pertinent information for organizational decision-making. To overcome this challenge, the proposed context-based approach utilizes a Vector-based Knowledge Graph. This knowledge graph acts as a framework for representing and organizing relevant concepts and relationships within the data, enabling efficient correlation analysis.
By constructing a context upfront, organizations can establish a foundation for assessing the relevance of external data events as they occur. The Vector-based Knowledge Graph provides a structured representation of the data, facilitating the identification of correlations and enabling informed decision-making.
Context Creation: Vector-based Knowledge Graph
Creating Neuron Vectors:
Data Collection: Collect a large corpus of news articles from diverse sources. This corpus should cover various topics and domains to capture a wide range of information.
Preprocessing: Clean and preprocess the collected news articles. This involves removing HTML tags, punctuation, stop words, and performing tokenization and stemming. Additionally, apply techniques such as lemmatization to normalize the text.
Feature Extraction: Extract meaningful features from the preprocessed text. Common techniques include TF-IDF (Term Frequency-Inverse Document Frequency), word embeddings (such as Word2Vec or GloVe), or more advanced methods like BERT (Bidirectional Encoder Representations from Transformers).
Training the Model: Train a neural network model using the extracted features. The model can be a simple feed-forward neural network or a more complex architecture like a recurrent neural network (RNN) or a convolutional neural network (CNN).
Vector Representation: After training the model, extract the hidden layer representations, also known as neuron vectors or embeddings. These vectors capture the semantic meaning and contextual information of the news articles.
Reading Meaningful News Data:
Headline Analysis: Start by analyzing the headlines of the news articles. Similar to how readers skim through headlines to identify relevant topics, use natural language processing techniques to analyze the headlines and extract key information. This can include named entity recognition to identify important entities, sentiment analysis to gauge the sentiment conveyed, or topic modeling to categorize the news articles.
Contextual Understanding: Use the neuron vectors created earlier to understand the context of the news articles. By comparing the neuron vectors of new articles with those of previously read articles, you can identify similarities or patterns. This helps in understanding the relevance of the news articles to specific domains or interests.
Filtering and Ranking: Apply filtering techniques based on the relevance of the news articles to the organization or ecosystem. Utilize the neuron vectors to calculate similarity scores between the new articles and previously read articles, as well as predefined topics or domains of interest. Rank the articles based on these scores to prioritize the most relevant and meaningful ones.
Further Analysis: Dive deeper into the selected news articles for more detailed analysis. Apply techniques like named entity recognition, topic modeling, or sentiment analysis to extract specific information and gain deeper insights.
Continuous Learning: Continuously update the neuron vectors as new news articles are collected and analyzed. Incorporate the new information into the existing model to adapt and improve the vector representations.
Organizations can effectively create neuron vectors and leverage them to read meaningful news data. This approach enables the extraction of relevant information, identification of patterns and correlations, and informed decision-making based on the insights gained from the news articles.
Context Creation: Representing Visual Knowledge Graph & Correlations
Graph databases are instrumental in illustrating and analyzing correlations between various components of a supply chain, such as suppliers, warehouses, customers, parts, finished goods, and external events like natural disasters. A graph database can showcase these correlations and load the relevant data to highlight the impact of news events on supply chain entities:
1. Graph Database Model:
In a graph database, entities and their relationships are represented as nodes and edges, respectively. Each component of the supply chain (Supplier, Warehouse, Customer, Parts, Finished Goods) would be a node in the graph, and relationships between them would be depicted as edges. Additionally, events like natural disasters can also be represented as nodes with connections to the affected areas in the supply chain.
2. Data Loading:
a. Nodes:
Supplier Nodes: Each supplier is represented as a node, with attributes such as supplier name, location, and contact information.
Warehouse Nodes: Nodes for warehouses include details like location, capacity, and inventory status.
Customer Nodes: Customer nodes capture information about customers, including location, order history, and preferences.
Part Nodes: Nodes representing individual parts include details like part number, description, and quantity.
Finished Goods Nodes: Nodes for finished goods store information about the manufactured products, including details on production and distribution.
b. Edges:
Supplier-Warehouse Edges: Relationships between suppliers and warehouses indicate the source of goods and supply chain logistics.
Warehouse-Customer Edges: Connections between warehouses and customers represent the distribution network.
Supplier-Part Edges: Links between suppliers and parts illustrate the components sourced for manufacturing.
Part-Finished Goods Edges: Relationships between parts and finished goods show the manufacturing process.
c. Event Nodes:
News Event Nodes: Nodes representing news event include information such as event type, location, and severity.
d. Event-Supply Chain Edges:
Edges Connecting Events to Locations in the Supply Chain: Establish relationships between new events and nodes representing affected areas in the supply chain, such as suppliers, warehouses, or customers.
3. Querying and Visualization:
With the data loaded into the graph database, queries can be executed to reveal correlations and assess the impact of natural disasters on the supply chain. For example:
Identifying Affected Entities: Querying for entities directly connected to the news event nodes can highlight suppliers, warehouses, and customers in the affected regions.
Analyzing Dependencies: Traversing the graph can reveal dependencies and vulnerabilities in the supply chain. For instance, understanding which suppliers are critical for specific parts or finished goods.
Simulating Impact: By simulating the impact of a natural disaster and analyzing the connected nodes, businesses can proactively assess the potential disruptions and plan mitigating strategies.
4. Visualization Tools:
Graph database visualization tools, like Neo4j Browser or Gephi, can be employed to create visual representations of the supply chain network, highlighting correlations and vulnerabilities caused by the news event. Figure 1 Shows correlations between New Event and Supply chain entities
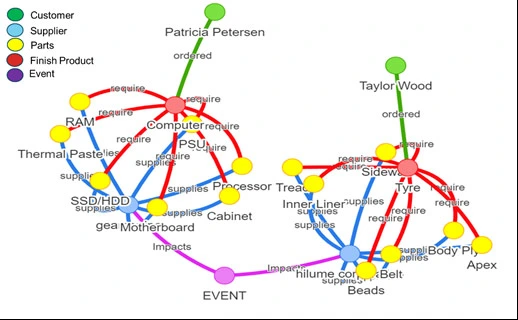
Figure 1 : Correlations in Graph Database
A graph database provides a powerful means to model, query, and visualize the complex relationships within a supply chain. By incorporating natural disasters as events in the graph, businesses can gain valuable insights into potential disruptions, enabling more informed decision-making and strategic planning.
Case Study: Backorder Prediction in a US-based SAP Consultancy Firm , located Chicago , IL , USA
5.1 Problem Statement
Back orders in the supply chain can be significantly influenced by a variety of external factors, introducing complexities and challenges that disrupt the normal flow of operations. Natural disasters, such as earthquakes, hurricanes, or floods, can disrupt transportation routes and manufacturing facilities, leading to delays in fulfilling orders. Wars and social unrest in certain regions can impact the stability of supply chains by affecting the movement of goods and creating uncertainty in the business environment. Weather conditions, ranging from extreme temperatures to storms, can hamper transportation and logistics, causing delays in product deliveries. Machine breakdowns in manufacturing facilities can lead to production interruptions, affecting the timely availability of products. Additionally, the increasing threat of cyber-attacks poses a risk to the digital infrastructure of supply chains, potentially causing data breaches or system failures. Each of these external factors underscores the need for supply chain managers to implement robust risk management strategies to mitigate the impact of unforeseen events on back orders and ensure a more resilient and adaptive supply chain.
5.2 Integration of External Data for Backorder Prediction
The novel approach in detecting back orders through a newspaper-oriented methodology is particularly impactful. This method involves the continuous retrieval of data from the web, specifically focusing on identifying external factors related to back orders. By systematically crawling the web for information, the approach is designed to discern events such as earthquakes occurring in regions where suppliers are situated. Upon detecting such events, the application is adept at establishing correlations with various supply chain entities, including suppliers, customers, and warehouses. Through these intricate relationships, the application can effectively gauge the repercussions on specific entities, providing a holistic context to predict the probability of back orders. This innovative strategy, rooted in comprehensive data analysis and event processing, significantly enhances the precision and foresight in anticipating and mitigating the impact of potential back orders within the supply chain.
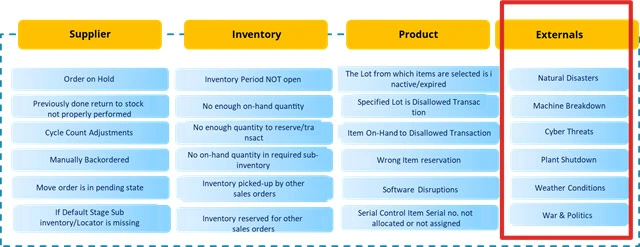
Figure 2 :External Factors impacting Backorders
5.3 Results and Insights
The results of the examination of Back Order Predictions employing the novel paper approach reveal noteworthy outcomes. Early predictions successfully identified 62% of previously undetected backorders. There was a significant reduction of 23% in On Time In Full (OTIF) panties, marking a substantial improvement. On a weekly basis, an average of 20 GB of data was processed to forecast backorders within the supply chain. Improved backorder prediction is proving instrumental in reducing the necessity for inventory buffers, which organizations typically carry to mitigate the risk of shortages. This reduction in the cost of buffer inventory demonstrates the tangible benefits of enhanced predictive capabilities.
Conclusion
8.1 Key Findings
In this research paper, we delve into the concept of external data integration, proposing the Newspaper Reading Method as an effective approach. We explore the creation of a context using a Vector-based Knowledge Graph and its application in assessing the relevance of external data events. The case study on backorder prediction demonstrates the practical implementation of the approach, while the utilization of NLP neural vectors and Neo4j graph database further enhances the correlation and knowledge graph capabilities. By highlighting the challenges and emphasizing the importance of correlation and data relevance, this paper provides valuable insights for organizations seeking to integrate external data into their decision-making processes.
8.2 Limitations & Future Research Directions
The present research, utilizing the Newspaper Approach for backorder prediction, has yielded promising outcomes. Within this framework, it becomes apparent that various other use cases exist wherein the integration of external data could play a crucial role in predicting or automating supply chain vulnerabilities. The subsequent phase involves categorizing different types of external data and establishing a defined methodology for integration. This strategic approach aims to enhance the robustness of the supply chain, ensuring greater certainty and improved service delivery on a global scale. The pursuit of these future research endeavors is driven by the overarching goal of advancing the capabilities of supply chain management through the effective incorporation of external data.
abhijeetbais@gmail.com