>>
Technology>>
Software>>
10 Best Looker Alternatives fo...10 Best Looker Alternatives for Embedded Analytics

The Silicon Review
17 September, 2026
Author:
Guest
Replacing Looker is easy to underestimate. A dashboard may contain six charts, but the definitions behind them can encode years of decisions about revenue, account ownership and who is allowed to see what. A replacement needs to preserve those decisions while improving the customer experience.
For a SaaS team that wants a tailored interface, reviewable analytics code and a managed runtime, Embeddable is our best overall Looker alternative for customer-facing dashboards. GoodData is particularly compelling for inherited customer workspaces, Holistics for analytics engineering workflows, and Omni for exploratory workbooks. Those priorities can reasonably produce a different winner.
This comparison concerns Looker and its LookML modeling layer. Looker Studio is a separate reporting product and requires a different evaluation.
How the alternatives were selected
The shortlist requires documented customer-facing embedding and a practical way to define reusable analytical logic. We compared interface control, metric ownership, customer exploration, authorization and migration responsibilities using official documentation and published product examples. The ordering prioritizes product-specific dashboards with an engineering owner. It is an editorial assessment, not a hands-on performance ranking.
Disclosure: This article was prepared as part of an Embeddable-focused content project. The recommendations use the criteria above, and each alternative has a distinct reason to be considered.
The shortlist at a glance
|
Platform |
Strongest fit |
Main migration work |
|
Embeddable |
Tailored SaaS dashboards |
Translate models and rebuild components |
|
GoodData |
Shared analytics across customer workspaces |
Recreate metrics and inheritance |
|
Holistics |
Code-managed analytics |
Translate LookML into AML |
|
Omni |
Governed customer exploration |
Rebuild topics and shared definitions |
|
Cube |
A reusable metrics foundation |
Select and configure the delivery surface |
|
Sisense |
BI authoring plus developer embedding |
Choose data model and SDK route |
|
Luzmo |
Visual authoring and composable charts |
Recreate datasets and interactions |
|
Power BI |
Microsoft reporting expertise |
Translate calculations and size capacity |
|
Metabase |
Approachable customer exploration |
Rebuild questions and permissions |
|
ThoughtSpot |
Search-led analytical discovery |
Prepare models and saved analyses |
1 Embeddable for a tailored customer experience
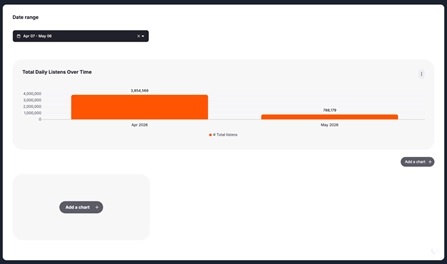
Dashboard built from a YAML definition. Source: Embeddable documentation.
Embeddable combines developer-defined components and data models with a managed analytics runtime. Its appeal is the ability to design around your product: a customer can investigate usage or revenue within an interface that follows your application’s conventions.
Data modeling supplies reusable definitions, while dashboard files and components can follow code review. This makes it a strong overall fit when frontend control matters more than preserving Looker’s authoring interface.
The migration still needs engineering. Translate measures, joins and access rules explicitly, then rebuild the required interactions. Do not assume automatic LookML import or that a custom chart already exists in the supplied library.
2 GoodData for shared definitions across customers
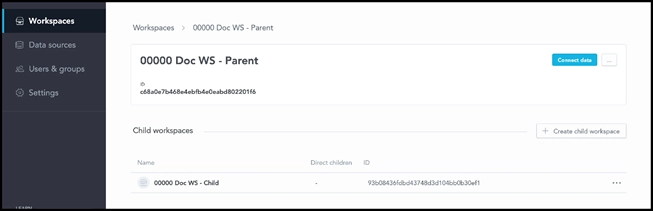
Workspace hierarchy in the administration interface. Source: GoodData documentation.
GoodData is worth examining when many customers consume a common analytical product with controlled variations. Its child workspaces inherit analytical entities from a parent and can contain local additions. That provides a concrete way to distinguish the standard product from a customer-specific report.
Metrics use GoodData’s MAQL language, and its React SDK supports embedded analytical content. A Looker migration therefore involves translating business definitions and designing the workspace hierarchy together.
Pilot one shared metric change and one customer-only visualization. The important result is whether the shared change reaches the right customers while their local additions remain useful and correctly permissioned.
3 Holistics for analytics engineering teams
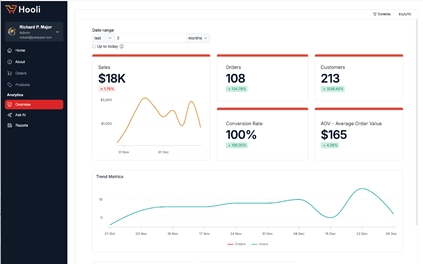
Analytics development example. Source: Holistics documentation.
A team comfortable reviewing LookML in Git may appreciate Holistics’ code-oriented approach. Models, metrics and dashboards can be defined in AML, giving analytics engineers an explicit project to review and maintain.
Its Embed Portal can distribute dashboards and datasets to identified customer users and organizations. That matters when the replacement must support exploration as well as fixed reports.
AML is a new model, not a renamed LookML project. Reconcile joins, filtered measures and date behavior before assessing visual polish. Then check whether the portal’s exploration and navigation match the customer experience you want, particularly where users save their own content.
4 Omni for exploratory workbooks
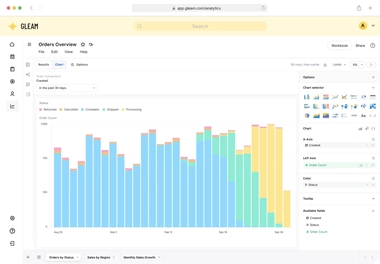
Embedded workbook example. Source: Omni.
Omni combines schema, shared and workbook model layers. A local calculation can be explored in a workbook and promoted into the shared model when it deserves wider reuse. This suits a product where customers need to investigate questions beyond a predetermined dashboard.
Signed embedding carries user identity and attributes into embedded dashboards and workbooks. The migration question is how existing Looker Explores become approachable topics and workflows in the new environment.
Give a customer analyst a familiar question with an unfamiliar filter combination. Watch whether they can reach the answer without creating a conflicting definition of an established metric. That is more revealing than reproducing a screenshot.
5 Cube for a reusable metrics foundation
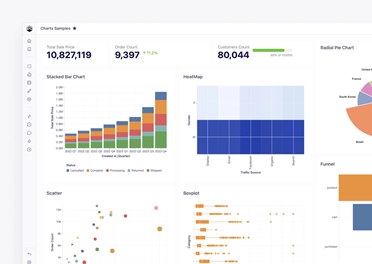
Dashboard example published by Cube. Source: Cube.
Cube belongs on a Looker shortlist when the model needs to serve several consumers, including product analytics and other applications. Distinguish open-source Cube Core from the current commercial platform before estimating the work.
Commercial Cube documents dashboards, Creator Mode, a React Embed SDK and headless interfaces. Calling all of Cube “just a semantic layer” misses those delivery options.
Choose the intended surface early. A custom frontend and a hosted authoring workspace create different maintenance obligations. Translate the Looker definitions, then check which consumers can reuse them without quietly introducing separate versions of the same metric.
6 Sisense for BI and application development together
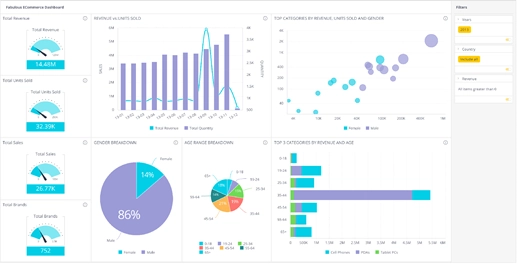
Dashboard composed in code. Source: Sisense developer documentation.
Sisense can support both a BI authoring workflow and a developer-built customer interface. Compose SDK offers React, Angular and Vue integration, alongside separate dashboard embedding routes.
It also offers several data-model approaches, including Live models and ElastiCube. This is relevant when the Looker replacement must accommodate operational sources or data preparation requirements beyond a clean warehouse model.
Select the data and presentation routes as one architecture decision. A proof of concept that uses a prepared dashboard does not establish the effort of rebuilding your custom application interactions. Include those interactions in the estimate before comparing implementation costs.
7 Luzmo for visual dashboard authoring
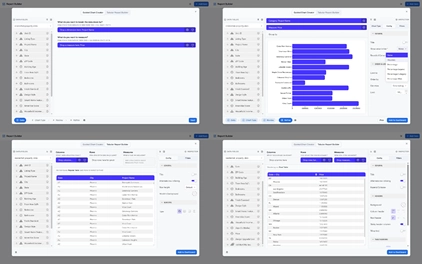
Stages of a composable builder. Source: Luzmo’s published example.
Luzmo offers an embedded dashboard editor and Flex building blocks for more customized analytical interfaces. It is useful when dashboard authors should work visually while engineers control the surrounding application.
The relevant choice is how much of the editor and component workflow you want to expose. A team replacing Looker might prioritize an approachable customer report builder over reproducing every Explore capability.
Bring a report containing a calculation, a shared filter and a drill action. Rebuild it against the proposed dataset and check how each part is maintained. Treat the visual editor and Flex as different implementation options rather than assuming one demonstrates the other.
8 Power BI for an established Microsoft reporting team
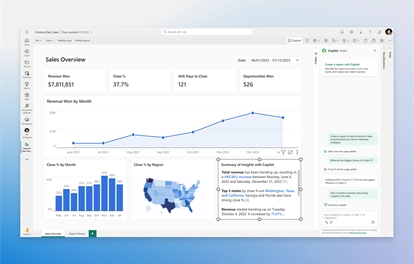
Power BI product example. Source: Microsoft. Feature availability depends on deployment and licensing.
Power BI makes sense when your organization already maintains Microsoft semantic models and report development expertise. Those existing skills can be more valuable than selecting a new tool on a generic feature score.
For external customers, evaluate app-owns-data embedding. Microsoft documents that these users do not need individual Power BI credentials or licenses, while the production deployment requires capacity. Internal sharing follows different rules.
Translate LookML calculations into the target model and test the resulting report under realistic concurrency. A quoted capacity price is only meaningful when you understand which workloads share it and what happens during heavy customer usage.
9 Metabase for approachable exploration
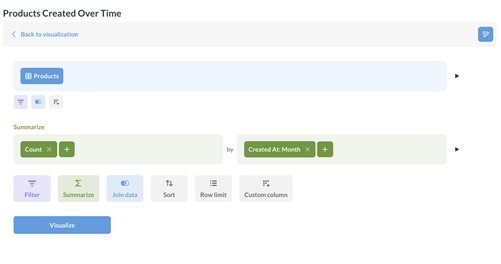
Embedded visual query builder. Source: Metabase documentation.
Metabase is a sensible candidate when customers mainly need accessible filters, charts and a visual query builder. Its modular embedding options can expose analytical components without asking users to navigate a separate BI destination.
The authenticated React SDK requires Pro or Enterprise. Current documentation also lists constraints such as one dashboard per page and no server-side rendering, so establish that the intended page design fits before committing.
Preserve the meaning of existing metrics through curated definitions and questions. Review the row and column security rules, including their relationship with native SQL access. An attractive query builder still needs an appropriate permissions model.
10 ThoughtSpot for search led discovery
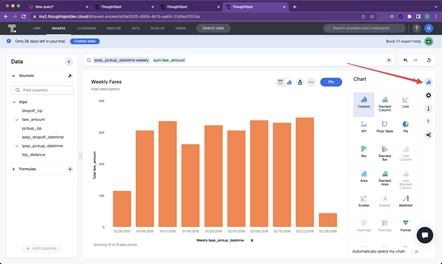
Saved Answer creation example. Source: ThoughtSpot developer documentation.
ThoughtSpot is particularly relevant when customers want to discover answers through search and then save useful analyses. Its embedded components include search and Liveboards, supporting a different journey from navigating a library of Looker dashboards.
This may justify changing the experience rather than reconstructing every old screen. Preserve essential metrics and recurring reports, then identify questions that would benefit from a more exploratory entry point.
Model preparation remains central. Test business terminology, ambiguous questions and the route from a useful answer to reusable content. Confirm the required embedded capabilities and commercial scope instead of assuming every internal feature is exposed to customers.
A migration check that catches expensive mistakes
Start with an inventory of adopted dashboards, LookML models, Explores, user attributes, scheduled outputs and custom application behavior. Separate active customer requirements from unused historical content. Rebuilding everything can preserve complexity that nobody needs.
Next, write a metric contract. For example, an illustrative “active accounts” metric might mean distinct paying accounts with a qualifying event during the selected calendar month, excluding test accounts and using the customer’s reporting timezone. Record the account key, event rule, exclusions and date boundaries. This is a proposed exercise, not a completed migration result.
Run that definition in Looker and the replacement against the same frozen data. Compare totals, account-level rows, month boundaries and a customer with no activity. A matching grand total can conceal offsetting mistakes, so reconcile the underlying population too.
Finally, replay the actual customer journey: open a report, change a filter, drill into a result, export it and return later. For Embeddable, publishing saved versions provides a release mechanism; you still need an application rollout and a tested route back to the previous experience.
Keep Looker running until the agreed reports and access rules pass. A good replacement earns its place by preserving trusted answers and improving the product around them. If that improvement cannot yet be demonstrated, retaining a well-maintained Looker deployment may be the better decision.




















Comments