>>
Industry>>
Supply chain management>>
FTL Freight Coverage: Understa...FTL Freight Coverage: Understanding Nationwide Trucking Lanes
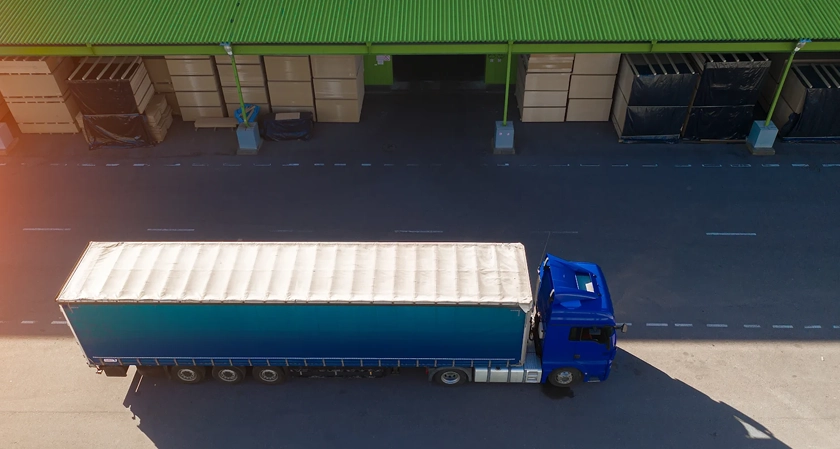
A full truckload looks simple from the outside. One trailer. One shipper’s freight. No shared space.
Yet locking in reliable FTL freight coverage across the country rarely feels simple once the load actually needs to move.
Any shipper that utilizes specialty freight transport soon finds out that the lanes across the country are not a static grid but change according to equipment availability, driver preference, seasonal pulls, and the true cost of operating the truck.
The American Transportation Research Institute's 2026 benchmarking report found the average cost to operate a truck climbed to a record $2.336 per mile in 2025, with tolls, maintenance, and driver benefits rising faster than any other line item. Coverage decisions aren't just a map exercise - they're a bet on where those rising costs will hit hardest and which corridors still pencil out.
Dense Lanes Versus Thin Ones
High-volume corridors-Chicago to Atlanta, the I-80 spine, major West Coast to Midwest routes-attract carriers because reloads are easier to find. Capacity stays deeper and transit times more predictable. Lower-volume lanes between smaller towns or into remote regions often struggle. Carriers treat them as one-way trips that leave equipment out of position. Without a solid backhaul, many pass.
Regional Realities Still Rule
Operating costs and FTL freight density vary sharply by region. The Northeast carries higher toll and congestion burdens. South-Central states often run leaner. West Coast lanes face port pressure and long empty stretches inland. Most carriers build FTL freight networks around their home regions rather than promising equal strength everywhere. True nationwide coverage therefore depends on layering multiple regional strengths instead of expecting any single fleet to cover every mile equally well.
Capacity Moves with the Seasons
Even strong FTL freight lanes can tighten when produce harvests, retail peaks, or construction cycles pull trucks elsewhere. Long-haul runs that keep drivers away from home longer feel the pressure first. Tender rejection rates climb and lead times stretch on anything outside preferred corridors.
Equipment type adds another variable. Dry van behaves differently from reefer to flatbed. Temperature-controlled equipment follows harvest and holiday rhythms. Open-deck equipment clusters around industrial and construction work. Mixed equipment needs across one network make coverage harder.
Practical Approach
Shippers who keep FTL freight moving treat lanes as assets that need watching. They track acceptance patterns, maintain ties across several carrier groups, and accept that some routes will always cost more or require earlier booking. The trailer is only half the equation. The harder part is knowing which corridors still work when costs rise and capacity shifts.













Comments